On this page
An average response time can improve while the slowest requests get worse. If that sounds contradictory, a small dataset makes it easier to see.
Take one hundred synthetic requests. Ninety take 100 milliseconds each. The remaining ten take 2,000 milliseconds each.
mean = (90 * 100 + 10 * 2,000) / 100
     = 290 milliseconds
The average is below a third of a second. One request in ten still takes two seconds. Someone making several requests can encounter that delay fairly often.
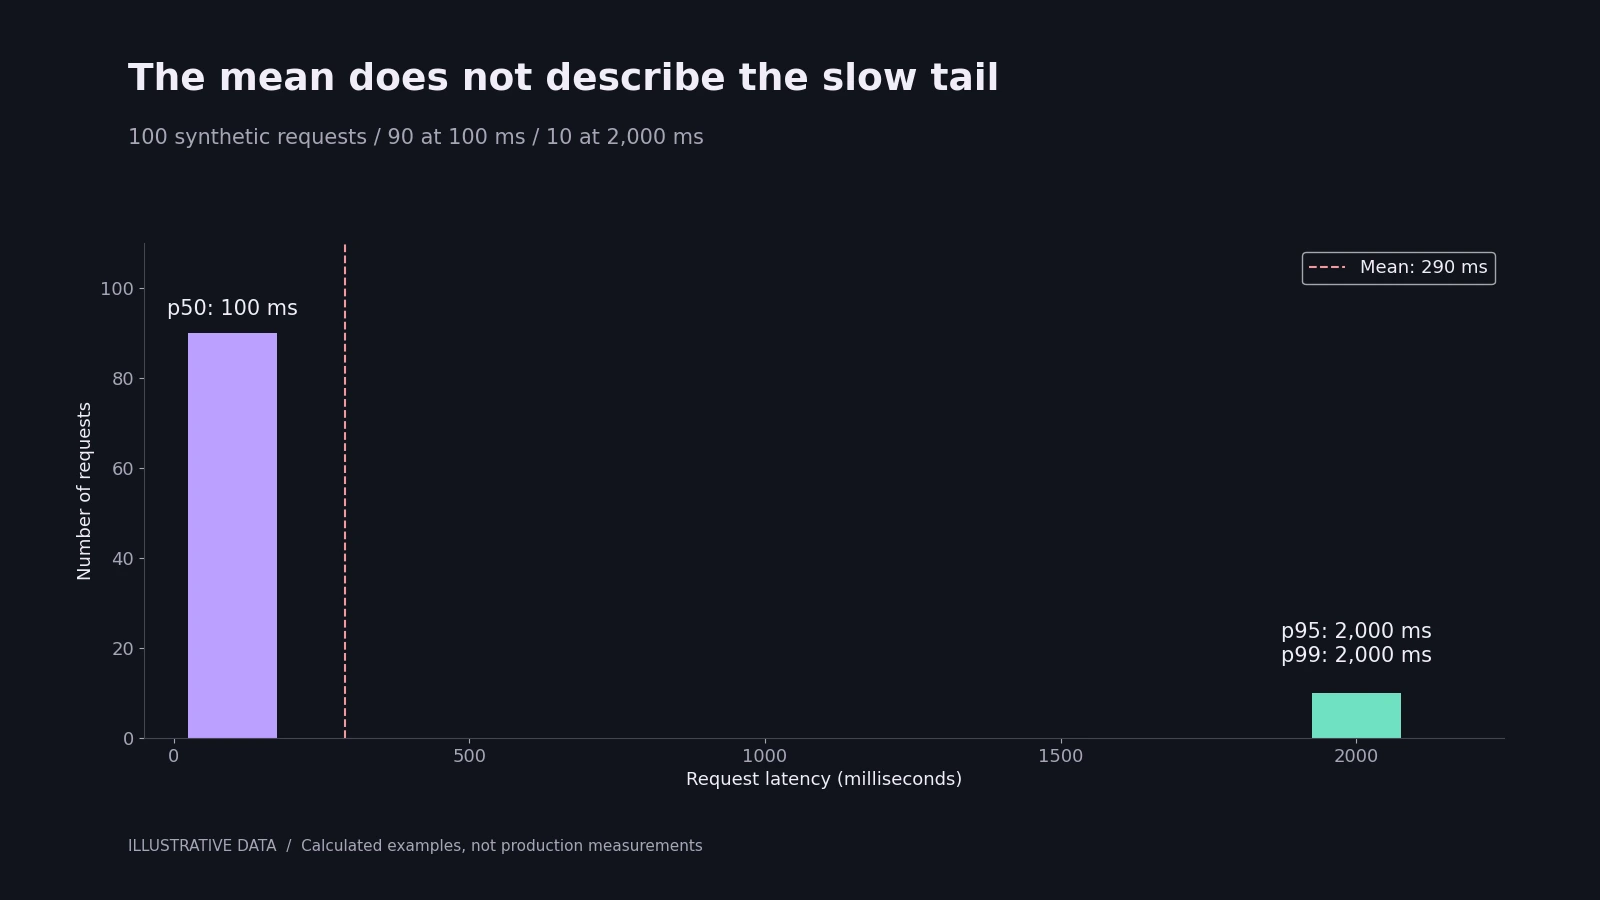
This is an intentionally simple dataset, not a production benchmark.
Read a few percentiles together
The median, or p50, describes the middle of the ordered observations. A p95 describes a point near the slow end, with the exact calculation depending on the selected percentile method.
In this example, the median is 100 milliseconds and p95 is 2,000 milliseconds. The mean lies between the two groups. None of these numbers can replace the others.
import numpy as np

latency_ms = [100] * 90 + [2000] * 10

print(np.mean(latency_ms))  # 290.0
print(np.percentile(latency_ms, [50, 95, 99], method='linear'))
# [100. 2000. 2000.]
Specifying the method makes the calculation reproducible. Different interpolation rules can produce different answers on a small dataset, especially close to a boundary between groups.
Put the sample count beside the percentile
A p99 from twenty observations deserves a different reading from a p99 based on a million. With a tiny sample, the reported value depends heavily on one or two observations and the interpolation method.
I want to see the count, the time window and what was measured. A number labelled "response time" might exclude connection setup, measure only successful requests, or stop at the first response byte instead of the completed body.
Those definitions can all be useful. Mixing them makes comparisons unreliable.
Do not average percentiles from separate groups
Suppose one machine handles ten requests and another handles ten thousand. Taking the average of their p95 values does not recover the p95 of the combined requests. Percentiles are not additive summaries.
Combine the underlying observations when practical, or use compatible histograms or another mergeable distribution representation. For the mean, retain sum and count rather than averaging unweighted machine averages.
The same problem appears across time. An hourly percentile chart should not be turned into a daily percentile by averaging its points.
Include failures in the investigation
A timeout is a user-visible outcome, even if the monitoring code drops it from the successful-response histogram. A change that turns slow requests into failures can make the remaining latency look better.
Track error rate beside latency. If a request hits a timeout limit, record that outcome explicitly. Do not pretend its true completion time was measured. It might never have completed.
It also helps to split requests by operation before looking for causes. A small metadata request and a large file transfer should not be expected to have the same distribution. Avoid creating so many tiny groups that each has an unusable sample count.
Choose the next measurement
If the median is stable but the tail grows, I would examine queues, resource contention, cold starts and external calls before changing the whole application. If every percentile shifts, the shared path deserves attention.
That is a starting point for an experiment, not a diagnosis from a chart. Capture enough timing detail to distinguish waiting for a connection from waiting for a query. Then repeat the comparison under similar load.
A fast average answers a narrow question. Pair it with the distribution, failures and a clear timing boundary, and the slow experience becomes much harder to hide.
Reference: NumPy's percentile definitions and methods.
THE CONVERSATION
What do you think?
A question, a different approach, or something worth adding.
Loading the conversation…
KEEP EXPLORING
More from the workbench
START A CONVERSATION
Have a problem worth solving?
Let’s talk about your idea, your team, or the work you’ve seen here.